import pandas as pd
import numpy as np
import seaborn as sns
import matplotlib.pyplot as plt
import ipywidgets as widgets
import plotly.express as px
import plotly.graph_objects as go
from ipywidgets import interact, interactive, fixed, interact_manual
df_cases = pd.read_csv('https://raw.githubusercontent.com/ishaberry/Covid19Canada/master/timeseries_prov/cases_timeseries_prov.csv')
df_deaths = pd.read_csv('https://raw.githubusercontent.com/ishaberry/Covid19Canada/master/timeseries_prov/mortality_timeseries_prov.csv')
df_recovered = pd.read_csv('https://raw.githubusercontent.com/ishaberry/Covid19Canada/master/timeseries_prov/recovered_timeseries_prov.csv')
df_testing = pd.read_csv('https://raw.githubusercontent.com/ishaberry/Covid19Canada/master/timeseries_prov/testing_timeseries_prov.csv')
df_cases
province | date_report | cases | cumulative_cases | |
---|---|---|---|---|
0 | Alberta | 25-01-2020 | 0 | 0 |
1 | Alberta | 26-01-2020 | 0 | 0 |
2 | Alberta | 27-01-2020 | 0 | 0 |
3 | Alberta | 28-01-2020 | 0 | 0 |
4 | Alberta | 29-01-2020 | 0 | 0 |
... | ... | ... | ... | ... |
5133 | Yukon | 21-01-2021 | 0 | 70 |
5134 | Yukon | 22-01-2021 | 0 | 70 |
5135 | Yukon | 23-01-2021 | 0 | 70 |
5136 | Yukon | 24-01-2021 | 0 | 70 |
5137 | Yukon | 25-01-2021 | 0 | 70 |
5138 rows × 4 columns
df_deaths
province | date_death_report | deaths | cumulative_deaths | |
---|---|---|---|---|
0 | Alberta | 08-03-2020 | 0 | 0 |
1 | Alberta | 09-03-2020 | 0 | 0 |
2 | Alberta | 10-03-2020 | 0 | 0 |
3 | Alberta | 11-03-2020 | 0 | 0 |
4 | Alberta | 12-03-2020 | 0 | 0 |
... | ... | ... | ... | ... |
4531 | Yukon | 21-01-2021 | 0 | 1 |
4532 | Yukon | 22-01-2021 | 0 | 1 |
4533 | Yukon | 23-01-2021 | 0 | 1 |
4534 | Yukon | 24-01-2021 | 0 | 1 |
4535 | Yukon | 25-01-2021 | 0 | 1 |
4536 rows × 4 columns
df_recovered
province | date_recovered | recovered | cumulative_recovered | |
---|---|---|---|---|
0 | Alberta | 12-02-2020 | 0 | 0 |
1 | Alberta | 13-02-2020 | 0 | 0 |
2 | Alberta | 14-02-2020 | 0 | 0 |
3 | Alberta | 15-02-2020 | 0 | 0 |
4 | Alberta | 16-02-2020 | 0 | 0 |
... | ... | ... | ... | ... |
4881 | Yukon | 21-01-2021 | 0 | 69 |
4882 | Yukon | 22-01-2021 | 0 | 69 |
4883 | Yukon | 23-01-2021 | 0 | 69 |
4884 | Yukon | 24-01-2021 | 0 | 69 |
4885 | Yukon | 25-01-2021 | 0 | 69 |
4886 rows × 4 columns
df_testing
province | date_testing | testing | cumulative_testing | testing_info | |
---|---|---|---|---|---|
0 | Alberta | 15-03-2020 | 7108 | 7108 | NaN |
1 | Alberta | 16-03-2020 | 3490 | 10598 | NaN |
2 | Alberta | 17-03-2020 | 1757 | 12355 | NaN |
3 | Alberta | 18-03-2020 | 2211 | 14566 | NaN |
4 | Alberta | 19-03-2020 | 2447 | 17013 | NaN |
... | ... | ... | ... | ... | ... |
4433 | Yukon | 21-01-2021 | 7 | 6210 | NaN |
4434 | Yukon | 22-01-2021 | 6 | 6216 | NaN |
4435 | Yukon | 23-01-2021 | 0 | 6216 | NaN |
4436 | Yukon | 24-01-2021 | 0 | 6216 | NaN |
4437 | Yukon | 25-01-2021 | 13 | 6229 | NaN |
4438 rows × 5 columns
df_cases['date_report']=pd.to_datetime(df_cases['date_report'])
df_deaths['date_death_report'] = pd.to_datetime(df_deaths['date_death_report'])
df_recovered['date_recovered'] = pd.to_datetime(df_recovered['date_recovered'])
df_testing['date_testing'] = pd.to_datetime(df_testing['date_testing'])
df1 = df_testing.merge(df_recovered,how='outer',left_on=['date_testing','province'],right_on=['date_recovered','province'])
df1
province | date_testing | testing | cumulative_testing | testing_info | date_recovered | recovered | cumulative_recovered | |
---|---|---|---|---|---|---|---|---|
0 | Alberta | 2020-03-15 | 7108.0 | 7108.0 | NaN | 2020-03-15 | 0 | 0 |
1 | Alberta | 2020-03-16 | 3490.0 | 10598.0 | NaN | 2020-03-16 | 0 | 0 |
2 | Alberta | 2020-03-17 | 1757.0 | 12355.0 | NaN | 2020-03-17 | 0 | 0 |
3 | Alberta | 2020-03-18 | 2211.0 | 14566.0 | NaN | 2020-03-18 | 0 | 0 |
4 | Alberta | 2020-03-19 | 2447.0 | 17013.0 | NaN | 2020-03-19 | 2 | 2 |
... | ... | ... | ... | ... | ... | ... | ... | ... |
4881 | Yukon | NaT | NaN | NaN | NaN | 2020-10-03 | 0 | 0 |
4882 | Yukon | NaT | NaN | NaN | NaN | 2020-11-03 | 0 | 0 |
4883 | Yukon | NaT | NaN | NaN | NaN | 2020-12-03 | 0 | 0 |
4884 | Yukon | NaT | NaN | NaN | NaN | 2020-03-13 | 0 | 0 |
4885 | Yukon | NaT | NaN | NaN | NaN | 2020-03-14 | 0 | 0 |
4886 rows × 8 columns
df2=df1.merge(df_deaths,how='outer',left_on=['date_recovered','province'],right_on=['date_death_report','province'])
df2
province | date_testing | testing | cumulative_testing | testing_info | date_recovered | recovered | cumulative_recovered | date_death_report | deaths | cumulative_deaths | |
---|---|---|---|---|---|---|---|---|---|---|---|
0 | Alberta | 2020-03-15 | 7108.0 | 7108.0 | NaN | 2020-03-15 | 0 | 0 | 2020-03-15 | 0.0 | 0.0 |
1 | Alberta | 2020-03-16 | 3490.0 | 10598.0 | NaN | 2020-03-16 | 0 | 0 | 2020-03-16 | 0.0 | 0.0 |
2 | Alberta | 2020-03-17 | 1757.0 | 12355.0 | NaN | 2020-03-17 | 0 | 0 | 2020-03-17 | 0.0 | 0.0 |
3 | Alberta | 2020-03-18 | 2211.0 | 14566.0 | NaN | 2020-03-18 | 0 | 0 | 2020-03-18 | 0.0 | 0.0 |
4 | Alberta | 2020-03-19 | 2447.0 | 17013.0 | NaN | 2020-03-19 | 2 | 2 | 2020-03-19 | 1.0 | 1.0 |
... | ... | ... | ... | ... | ... | ... | ... | ... | ... | ... | ... |
4881 | Yukon | NaT | NaN | NaN | NaN | 2020-10-03 | 0 | 0 | 2020-10-03 | 0.0 | 0.0 |
4882 | Yukon | NaT | NaN | NaN | NaN | 2020-11-03 | 0 | 0 | 2020-11-03 | 0.0 | 0.0 |
4883 | Yukon | NaT | NaN | NaN | NaN | 2020-12-03 | 0 | 0 | 2020-12-03 | 0.0 | 0.0 |
4884 | Yukon | NaT | NaN | NaN | NaN | 2020-03-13 | 0 | 0 | 2020-03-13 | 0.0 | 0.0 |
4885 | Yukon | NaT | NaN | NaN | NaN | 2020-03-14 | 0 | 0 | 2020-03-14 | 0.0 | 0.0 |
4886 rows × 11 columns
df3=df2.merge(df_cases,how='outer',left_on=['date_recovered','province'],right_on=['date_report','province'])
df3
province | date_testing | testing | cumulative_testing | testing_info | date_recovered | recovered | cumulative_recovered | date_death_report | deaths | cumulative_deaths | date_report | cases | cumulative_cases | |
---|---|---|---|---|---|---|---|---|---|---|---|---|---|---|
0 | Alberta | 2020-03-15 | 7108.0 | 7108.0 | NaN | 2020-03-15 | 0.0 | 0.0 | 2020-03-15 | 0.0 | 0.0 | 2020-03-15 | 17 | 56 |
1 | Alberta | 2020-03-16 | 3490.0 | 10598.0 | NaN | 2020-03-16 | 0.0 | 0.0 | 2020-03-16 | 0.0 | 0.0 | 2020-03-16 | 18 | 74 |
2 | Alberta | 2020-03-17 | 1757.0 | 12355.0 | NaN | 2020-03-17 | 0.0 | 0.0 | 2020-03-17 | 0.0 | 0.0 | 2020-03-17 | 23 | 97 |
3 | Alberta | 2020-03-18 | 2211.0 | 14566.0 | NaN | 2020-03-18 | 0.0 | 0.0 | 2020-03-18 | 0.0 | 0.0 | 2020-03-18 | 22 | 119 |
4 | Alberta | 2020-03-19 | 2447.0 | 17013.0 | NaN | 2020-03-19 | 2.0 | 2.0 | 2020-03-19 | 1.0 | 1.0 | 2020-03-19 | 27 | 146 |
... | ... | ... | ... | ... | ... | ... | ... | ... | ... | ... | ... | ... | ... | ... |
5133 | Yukon | NaT | NaN | NaN | NaN | NaT | NaN | NaN | NaT | NaN | NaN | 2020-07-02 | 0 | 0 |
5134 | Yukon | NaT | NaN | NaN | NaN | NaT | NaN | NaN | NaT | NaN | NaN | 2020-08-02 | 0 | 0 |
5135 | Yukon | NaT | NaN | NaN | NaN | NaT | NaN | NaN | NaT | NaN | NaN | 2020-09-02 | 0 | 0 |
5136 | Yukon | NaT | NaN | NaN | NaN | NaT | NaN | NaN | NaT | NaN | NaN | 2020-10-02 | 0 | 0 |
5137 | Yukon | NaT | NaN | NaN | NaN | NaT | NaN | NaN | NaT | NaN | NaN | 2020-11-02 | 0 | 0 |
5138 rows × 14 columns
df4=df3.sort_values('date_report',ascending=False)
data_set = df4.drop(columns=['date_testing','testing_info','date_recovered','date_death_report'])
data_set
province | testing | cumulative_testing | recovered | cumulative_recovered | deaths | cumulative_deaths | date_report | cases | cumulative_cases | |
---|---|---|---|---|---|---|---|---|---|---|
3156 | PEI | 1917.0 | 81756.0 | 1.0 | 95.0 | 0.0 | 0.0 | 2021-12-01 | 1 | 103 |
1254 | New Brunswick | 1329.0 | 164885.0 | 0.0 | 586.0 | 2.0 | 11.0 | 2021-12-01 | 17 | 817 |
2522 | NWT | 0.0 | 10231.0 | 0.0 | 24.0 | 0.0 | 0.0 | 2021-12-01 | 0 | 24 |
937 | Manitoba | 1373.0 | 441905.0 | 397.0 | 22692.0 | 7.0 | 747.0 | 2021-12-01 | 89 | 26537 |
4107 | Saskatchewan | 842.0 | 315256.0 | 226.0 | 14814.0 | 5.0 | 203.0 | 2021-12-01 | 248 | 18776 |
... | ... | ... | ... | ... | ... | ... | ... | ... | ... | ... |
5019 | NWT | NaN | NaN | NaN | NaN | NaN | NaN | 2020-01-02 | 0 | 0 |
4947 | New Brunswick | NaN | NaN | NaN | NaN | NaN | NaN | 2020-01-02 | 0 | 0 |
5037 | Ontario | NaN | NaN | NaN | NaN | NaN | NaN | 2020-01-02 | 0 | 3 |
5109 | Saskatchewan | NaN | NaN | NaN | NaN | NaN | NaN | 2020-01-02 | 0 | 0 |
5073 | Quebec | NaN | NaN | NaN | NaN | NaN | NaN | 2020-01-02 | 0 | 0 |
5138 rows × 10 columns
data_set1=data_set.head(14)
data_set1
province | testing | cumulative_testing | recovered | cumulative_recovered | deaths | cumulative_deaths | date_report | cases | cumulative_cases | |
---|---|---|---|---|---|---|---|---|---|---|
3156 | PEI | 1917.0 | 81756.0 | 1.0 | 95.0 | 0.0 | 0.0 | 2021-12-01 | 1 | 103 |
1254 | New Brunswick | 1329.0 | 164885.0 | 0.0 | 586.0 | 2.0 | 11.0 | 2021-12-01 | 17 | 817 |
2522 | NWT | 0.0 | 10231.0 | 0.0 | 24.0 | 0.0 | 0.0 | 2021-12-01 | 0 | 24 |
937 | Manitoba | 1373.0 | 441905.0 | 397.0 | 22692.0 | 7.0 | 747.0 | 2021-12-01 | 89 | 26537 |
4107 | Saskatchewan | 842.0 | 315256.0 | 226.0 | 14814.0 | 5.0 | 203.0 | 2021-12-01 | 248 | 18776 |
1571 | NL | 289.0 | 75103.0 | 1.0 | 382.0 | 0.0 | 4.0 | 2021-12-01 | 0 | 393 |
3473 | Quebec | 7815.0 | 2611556.0 | 1982.0 | 199920.0 | 45.0 | 8782.0 | 2021-12-01 | 1934 | 232624 |
4424 | Yukon | 12.0 | 6118.0 | 0.0 | 63.0 | 0.0 | 1.0 | 2021-12-01 | 0 | 70 |
2839 | Ontario | 44802.0 | 8479734.0 | 3353.0 | 186829.0 | 64.0 | 5139.0 | 2021-12-01 | 2691 | 226657 |
620 | BC | 5785.0 | 1548105.0 | 603.0 | 51144.0 | 9.0 | 1019.0 | 2021-12-01 | 446 | 58553 |
303 | Alberta | 9374.0 | 2950446.0 | 1311.0 | 98178.0 | 38.0 | 1345.0 | 2021-12-01 | 652 | 112743 |
1888 | Nova Scotia | 2408.0 | 254759.0 | 0.0 | 1442.0 | 0.0 | 65.0 | 2021-12-01 | 1 | 1534 |
2205 | Nunavut | -67.0 | 2490.0 | 0.0 | 265.0 | 0.0 | 2.0 | 2021-12-01 | 0 | 266 |
3790 | Repatriated | 0.0 | 0.0 | 0.0 | 13.0 | 0.0 | 0.0 | 2021-12-01 | 0 | 13 |
data_table = pd.DataFrame()
data_table['province'] = data_set1['province']
data_table['total_cases']= data_set1['cumulative_cases']
data_table['total_deaths']= data_set1['cumulative_deaths']
data_table['total_recovered']= data_set1['cumulative_recovered']
data_table['total_tested']= data_set1['cumulative_testing']
data_table
province | total_cases | total_deaths | total_recovered | total_tested | |
---|---|---|---|---|---|
3156 | PEI | 103 | 0.0 | 95.0 | 81756.0 |
1254 | New Brunswick | 817 | 11.0 | 586.0 | 164885.0 |
2522 | NWT | 24 | 0.0 | 24.0 | 10231.0 |
937 | Manitoba | 26537 | 747.0 | 22692.0 | 441905.0 |
4107 | Saskatchewan | 18776 | 203.0 | 14814.0 | 315256.0 |
1571 | NL | 393 | 4.0 | 382.0 | 75103.0 |
3473 | Quebec | 232624 | 8782.0 | 199920.0 | 2611556.0 |
4424 | Yukon | 70 | 1.0 | 63.0 | 6118.0 |
2839 | Ontario | 226657 | 5139.0 | 186829.0 | 8479734.0 |
620 | BC | 58553 | 1019.0 | 51144.0 | 1548105.0 |
303 | Alberta | 112743 | 1345.0 | 98178.0 | 2950446.0 |
1888 | Nova Scotia | 1534 | 65.0 | 1442.0 | 254759.0 |
2205 | Nunavut | 266 | 2.0 | 265.0 | 2490.0 |
3790 | Repatriated | 13 | 0.0 | 13.0 | 0.0 |
(data_table.style.set_properties(**{'text-align': 'right'}).background_gradient(cmap='Reds').hide_index()).set_caption(
'province most affected by coronavirus')
province | total_cases | total_deaths | total_recovered | total_tested |
---|---|---|---|---|
PEI | 103 | 0.000000 | 95.000000 | 81756.000000 |
New Brunswick | 817 | 11.000000 | 586.000000 | 164885.000000 |
NWT | 24 | 0.000000 | 24.000000 | 10231.000000 |
Manitoba | 26537 | 747.000000 | 22692.000000 | 441905.000000 |
Saskatchewan | 18776 | 203.000000 | 14814.000000 | 315256.000000 |
NL | 393 | 4.000000 | 382.000000 | 75103.000000 |
Quebec | 232624 | 8782.000000 | 199920.000000 | 2611556.000000 |
Yukon | 70 | 1.000000 | 63.000000 | 6118.000000 |
Ontario | 226657 | 5139.000000 | 186829.000000 | 8479734.000000 |
BC | 58553 | 1019.000000 | 51144.000000 | 1548105.000000 |
Alberta | 112743 | 1345.000000 | 98178.000000 | 2950446.000000 |
Nova Scotia | 1534 | 65.000000 | 1442.000000 | 254759.000000 |
Nunavut | 266 | 2.000000 | 265.000000 | 2490.000000 |
Repatriated | 13 | 0.000000 | 13.000000 | 0.000000 |
data_table_daily = pd.DataFrame()
data_table_daily['province'] = data_set1['province']
data_table_daily['cases']= data_set1['cases']
data_table_daily['deaths']= data_set1['deaths']
data_table_daily['recovered']= data_set1['recovered']
data_table_daily['tested']= data_set1['testing']
(data_table_daily.style.set_properties(**{'text-align': 'right'}).background_gradient(cmap='Reds').hide_index()).set_caption(
'province most affected by coronavirus')
province | cases | deaths | recovered | tested |
---|---|---|---|---|
PEI | 1 | 0.000000 | 1.000000 | 1917.000000 |
New Brunswick | 17 | 2.000000 | 0.000000 | 1329.000000 |
NWT | 0 | 0.000000 | 0.000000 | 0.000000 |
Manitoba | 89 | 7.000000 | 397.000000 | 1373.000000 |
Saskatchewan | 248 | 5.000000 | 226.000000 | 842.000000 |
NL | 0 | 0.000000 | 1.000000 | 289.000000 |
Quebec | 1934 | 45.000000 | 1982.000000 | 7815.000000 |
Yukon | 0 | 0.000000 | 0.000000 | 12.000000 |
Ontario | 2691 | 64.000000 | 3353.000000 | 44802.000000 |
BC | 446 | 9.000000 | 603.000000 | 5785.000000 |
Alberta | 652 | 38.000000 | 1311.000000 | 9374.000000 |
Nova Scotia | 1 | 0.000000 | 0.000000 | 2408.000000 |
Nunavut | 0 | 0.000000 | 0.000000 | -67.000000 |
Repatriated | 0 | 0.000000 | 0.000000 | 0.000000 |
def covid_bubble_chart():
df = data_table_daily
fig = px.scatter(df, x="province", y="cases", size="cases", color="province",
hover_name="province", size_max=90)
fig.update_layout(
title="Total province cases",
xaxis_title="Province",
yaxis_title="Confirmed Cases",
width = 700
)
fig.show();
fig = go.FigureWidget( layout=go.Layout() )
interact(covid_bubble_chart)
ipywLayout = widgets.Layout(border='solid 2px green')
ipywLayout.display='none'
widgets.VBox([fig], layout=ipywLayout)
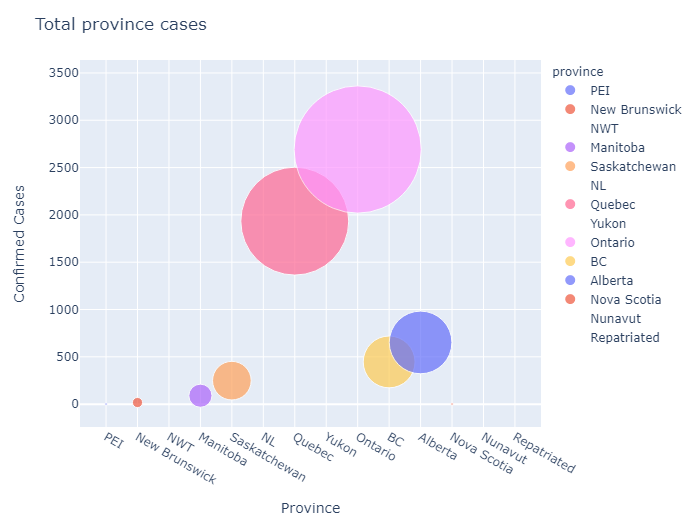
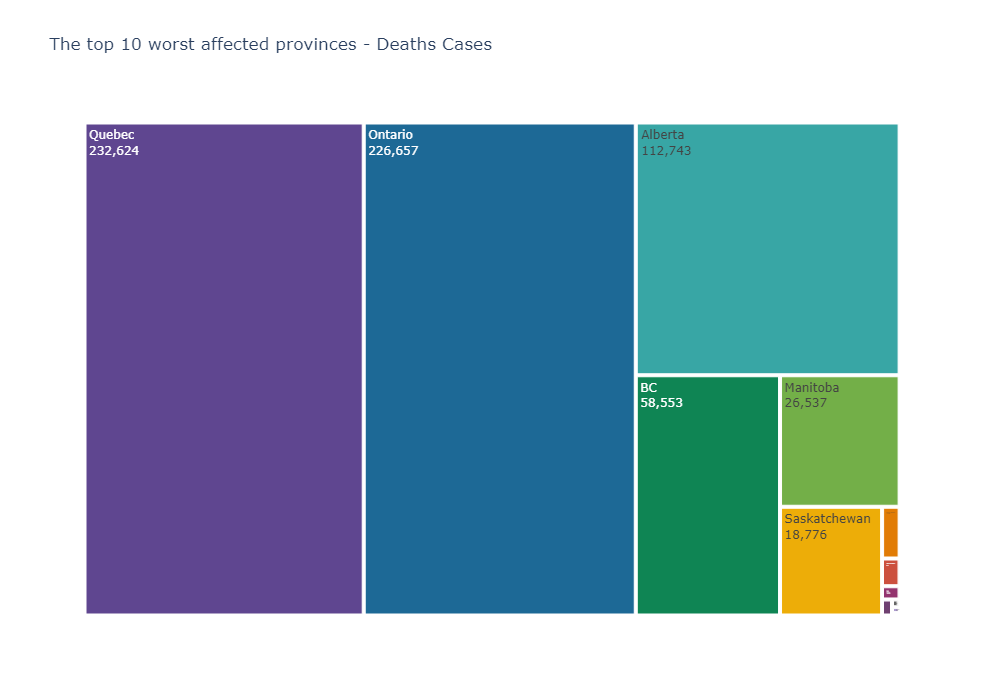
fig = px.treemap(data_table,
path=["province"],
values="total_cases", height=700,
title='The top 10 worst affected provinces - Deaths Cases',
color_discrete_sequence = px.colors.qualitative.Prism)
fig.data[0].textinfo = 'label+text+value'
fig.show()
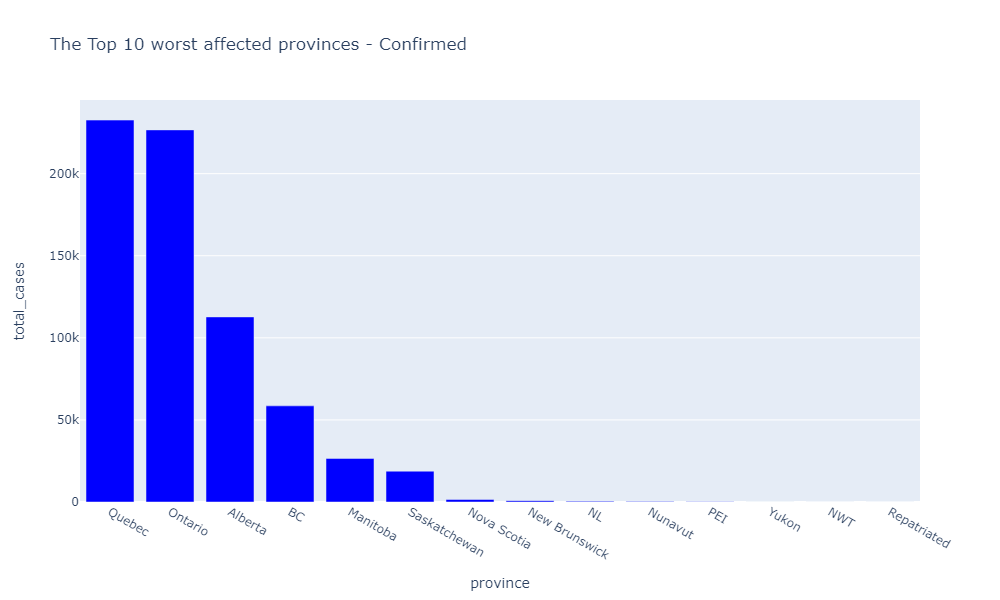
data_table_sorted_cases=data_table.sort_values('total_cases',ascending=False)
fig = px.bar(data_table_sorted_cases,
x = "province",
y = "total_cases",
title= "The Top 10 worst affected provinces - Confirmed",
color_discrete_sequence=["blue"],
height=600,
width=1000
)
fig.show()
data_set
province | testing | cumulative_testing | recovered | cumulative_recovered | deaths | cumulative_deaths | date_report | cases | cumulative_cases | |
---|---|---|---|---|---|---|---|---|---|---|
3156 | PEI | 1917.0 | 81756.0 | 1.0 | 95.0 | 0.0 | 0.0 | 2021-12-01 | 1 | 103 |
1254 | New Brunswick | 1329.0 | 164885.0 | 0.0 | 586.0 | 2.0 | 11.0 | 2021-12-01 | 17 | 817 |
2522 | NWT | 0.0 | 10231.0 | 0.0 | 24.0 | 0.0 | 0.0 | 2021-12-01 | 0 | 24 |
937 | Manitoba | 1373.0 | 441905.0 | 397.0 | 22692.0 | 7.0 | 747.0 | 2021-12-01 | 89 | 26537 |
4107 | Saskatchewan | 842.0 | 315256.0 | 226.0 | 14814.0 | 5.0 | 203.0 | 2021-12-01 | 248 | 18776 |
... | ... | ... | ... | ... | ... | ... | ... | ... | ... | ... |
5019 | NWT | NaN | NaN | NaN | NaN | NaN | NaN | 2020-01-02 | 0 | 0 |
4947 | New Brunswick | NaN | NaN | NaN | NaN | NaN | NaN | 2020-01-02 | 0 | 0 |
5037 | Ontario | NaN | NaN | NaN | NaN | NaN | NaN | 2020-01-02 | 0 | 3 |
5109 | Saskatchewan | NaN | NaN | NaN | NaN | NaN | NaN | 2020-01-02 | 0 | 0 |
5073 | Quebec | NaN | NaN | NaN | NaN | NaN | NaN | 2020-01-02 | 0 | 0 |
5138 rows × 10 columns
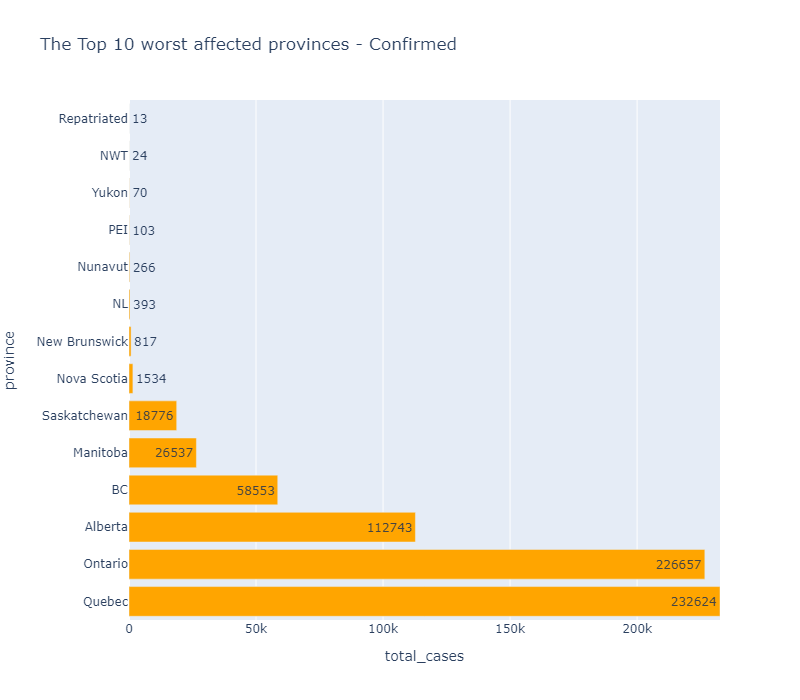
figura = px.bar(data_table_sorted_cases,
x="total_cases", y="province",
title='The Top 10 worst affected provinces - Confirmed',
text='total_cases', orientation='h',
color_discrete_sequence=["orange"],
width=800, height=700, range_x = [0, max(data_table_sorted_cases['total_cases'])])
figura.show()